Medicine’s Renaissance
For most of history, medicine was guided by tradition and anecdote, often clouded by superstition. Treatments, from bloodletting to mercury, often did more harm than good.
It wasn’t until the 19th century that things began to change with breakthroughs like Pasteur and Koch’s germ theory, Lister’s antiseptic technique, and the introduction of anesthesia which transformed medicine from a ritual to a science.
The 20th century brought population medicine: diagnostics, clinical trials, epidemiology, and, by its end, electronic health records. These advances extended life expectancy by more than 30 years: an extraordinary achievement for a system built on population averages.
Now, we are entering a new era for medicine as transformative as the Renaissance was for art and science. Just as Renaissance thinkers overturned centuries of dogma by placing the human at the centre of knowledge, today’s revolution is shifting medicine from population averages to the individual as the central unit of care.
And as always, when information scales, economics follow. Data is becoming medicine’s new substrate and the next trillion dollars of healthcare value will flow to those who can build systems that translate biology into real-time intelligence.
But this shift cannot be realised with 20th-century tools. It demands new infrastructure, new data, and a new philosophy of care.
So before we continue, we must ask:
What must be true for the system to truly understand you?
The Evolution of Health Data
The rise of Electronic Health Records (EHR) in the late 20th and early 21st century marked medicine’s first leap into the digital age. By 2017, over 80% of U.S. hospitals had adopted EHRs, opening the door to a new era of insight.
In just 25 years, healthcare became the world’s most data-intensive industry, generating over 30% of all global data and growing at an astonishing 36% annually (RBC Capital Markets).
Until the early 2000s, most of this data sat within public-sector systems like hospital records and national registries. But in just 25 years, the balance flipped. Today, much of the highest-resolution, real-time health data is captured and monetised by private platforms: wearables, apps, and consumer devices.
If the current trends continue, the future of health data will be reshaped by two interlinked forces:
- Privatization: Fastest-growing signals from wearables, sensors, apps, voice are captured outside traditional clinical systems. Private companies now process and monetise the data that defines risk, diagnosis, and intervention.
- Multimodality: Continuously tracked data across sleep, movement, mood, nutrition, and other biological signals is augmenting and in some cases outperforming traditional datasets like EHRs in predictive power.
The result is a historic inversion where private platforms now hold the majority of health data in both storage volume and value:
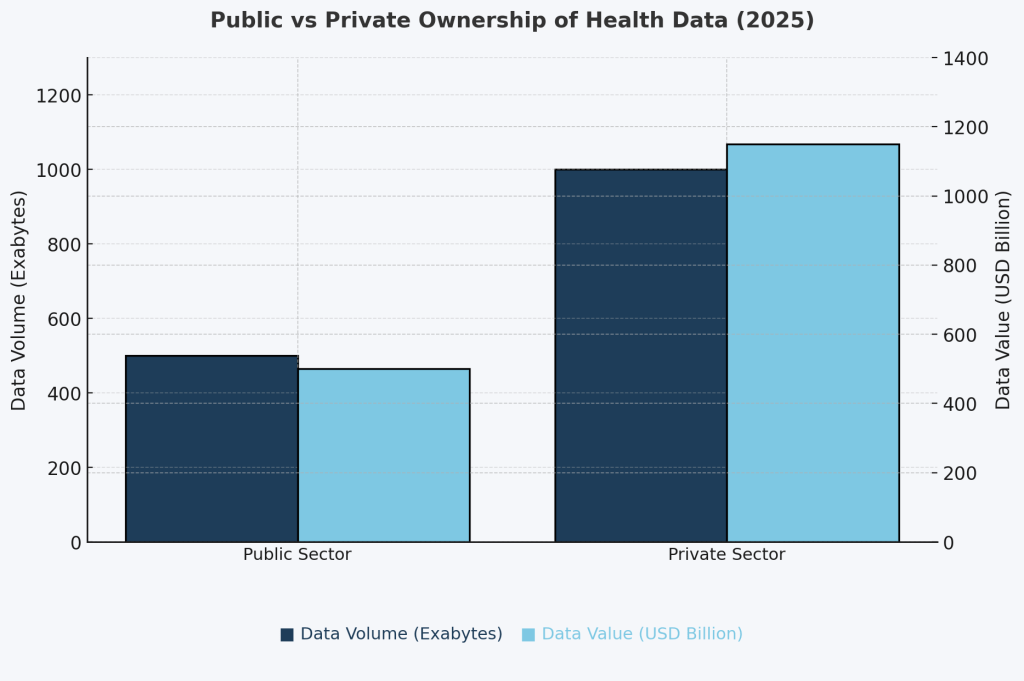
Footnote: Estimates adapted from STAT News (2023), OECD Health Data Governance Reports (2022), Deloitte Insights (2023), and Nature Digital Medicine. Volume figures based on extrapolated storage from cloud providers, public health systems, and proprietary datasets. Value estimates derived from industry benchmarks in health data monetization, pharma R&D, and digital health M&A.
In this new era, companies capturing high-frequency health information are positioned to train more accurate AI models with sharper medical insights since AI’s power scales with the volume, diversity, and granularity of the data it ingests.
But this abundance created a deeper paradox: as health data multiplies and diversifies, its predictive power, interpretability, and economic value are diverging.
The Great Divergence & the Coming Fusion
The term “health data” is misleading: it is an ecosystem of modalities like clinical notes, imaging, genomics, wearables each evolving at its own pace, shaped by science, technology, and market adoption.
While legacy systems like EHRs continue a steady climb, imaging and genomics are accelerating, and wearables are set to dominate with estimated $280 billion in market value by 2035:
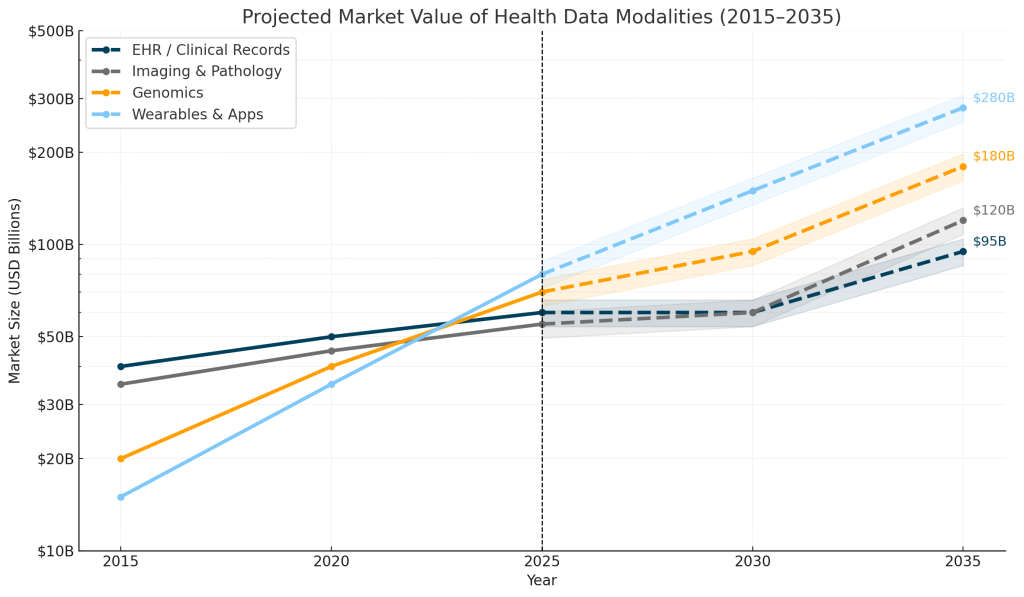
Footnote: Projections consolidate ranges reported by major industry analyses (McKinsey, RBC, Fortune BI, Grand View, IQVIA, BCC). Values are directional estimates, rounded for clarity, and shown on a logarithmic scale to illustrate long-term structural trends rather than precise forecasts.
This growth, however, conceals a paradox: the modalities generating the most data aren’t necessarily the ones generating the most clinical insight.
Across studies from Google Research, Stanford, and EMBL-EBI, multimodal models consistently outperform single-source data such as EHRs, labs, wearables, or genomics alone. While each modality contributes a unique signal, in our estimate, the real breakthroughs will comes from innovative fusion of data modalities which amplifies predictive power.
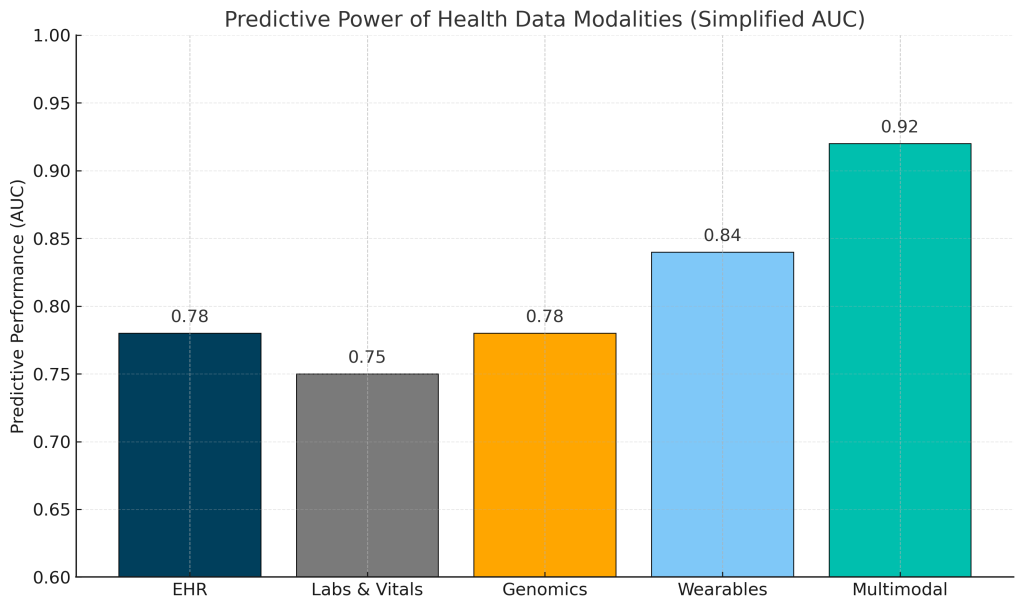
Footnote: AUC values shown here are illustrative mid-range estimates derived from published models across major datasets (e.g., MIMIC, UK Biobank, Apple Heart Study). Actual performance varies by disease, cohort, feature engineering, and prediction horizon. Typical ranges reported in the literature are: EHR 0.70–0.85, Labs/Vitals 0.70–0.80, Genomics 0.60–0.80, Wearables 0.80–0.90, and Multimodal 0.88–0.95. The purpose of this figure is to highlight relative predictive signal across modalities rather than task-specific precision.
Quantification: Predictive Value per Byte
Predictive performance tells us what each health data modality can do once it’s inside an AI model. But the deeper challenge lies in efficiency: how much usable signal per unit of data can a health AI model extract? In other words, we need to quantify the data that quantifies us.
To evaluate this, we introduce Predictive Value per Byte (PVB): a composite measure that captures the predictive power of a modality relative to the effort and cost required to operationalise it. PVB is composed of three factors:
- Predictability: The measurable predictive signal a modality contributes to clinical tasks (e.g., AUC).
- Accessibility /Quality: The practical difficulty of acquiring, standardising, governing, and maintaining the data at high fidelity across clinical, technical, and commercial boundaries. This reflects interoperability maturity, regulatory friction, and real-world availability.
- Cost Efficiency: The total cost of transforming raw data into model-ready features, including extraction, cleaning, harmonisation, storage, and compute.
When quantified through PVB, the landscape of health data looks very different, showing that wearables and EHRs show easiest conversion of data volume into clinical value:
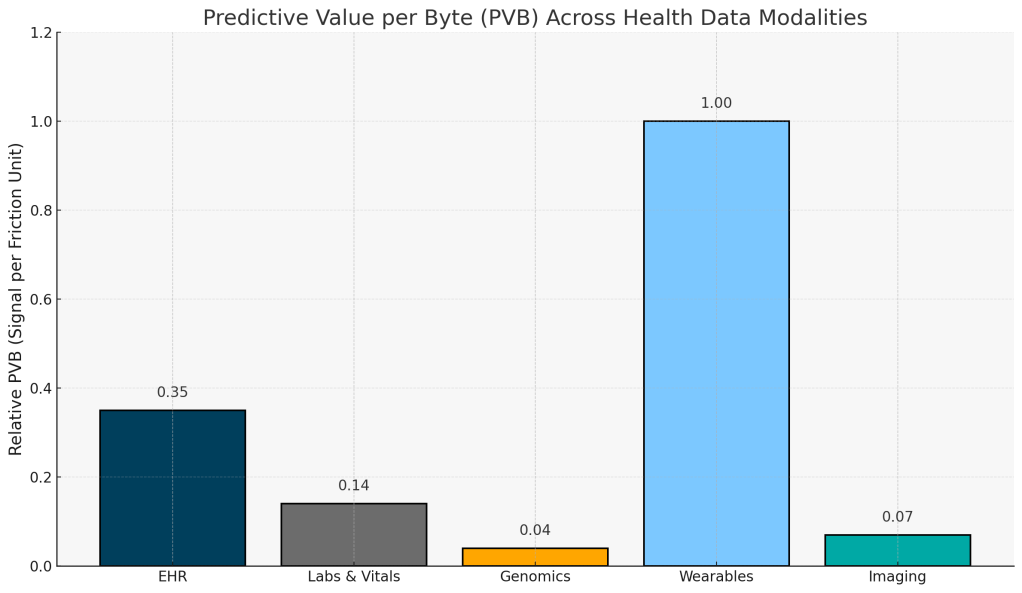
Footnote: PVB values are computed as (AUC × Accessibility/Quality) ÷ Estimated Cost, using mid-range AUC estimates from published models and illustrative AQ and cost inputs shown in the Methods section. Scores are aligned to enable relative comparison of modalities, not precise economic accounting. For more detail see the Methods section.
Ultimately, the next wave of innovation in medicine will hinge on raising this ratio. Each breakthrough in predictability, cost reduction, and real-world data capture will lower the cost of insight, bringing us closer to health systems that learn continuously and operate in real time.
From Data to Decisions We Can Trust
As the body becomes more legible, health will shift from something most people encounter a few times a year at a clinic to a constant companion. The 20th century’s medicine was built on population averages, the 21st will be built on data-led personal precision that makes the invisible nuances of our biology visible.
That’s why we close with three mental models redefining healthcare in the age of health data:
- From Hospital to Home: Home is becoming the new diagnostic frontier, the most meaningful health data will come from daily life, not hospitals (with the exception of imaging).
- From Snapshot to Multimodality: Longitudinal data will power the next generation of AI health models, and in combination will surpass the diagnostic accuracy of static electronic health records.
- From Systems to Self: As health intelligence decentralizes, the individual becomes the most important unit. The self and not the hospital becomes the node of continuous learning, quantification, and medical understanding.
The next generation of healthcare value will come from platforms that can connect these layers: turning continuous data from the home and the clinic into infrastructure that compounds in clinical insight and return over time.
Earlier we asked: What must be true for the system to understand you?
The answer is simple: it must first see you clearly and data is the lens that makes that vision possible.
Data is the foundation; infrastructure and intelligence are the next layers. And that’s what we’ll explore in:
Part 2: The Software That Learns You
Sources: Google Research, Stanford University, EMBL-EBI, NIH, UK Biobank, Apple Heart Study, MIMIC-IV, RBC Capital Markets, McKinsey, BCG, OECD Health Data Governance Reports, IEEE Sensors Journal, Nature Medicine, Nature Digital Medicine, and Fortune Business Insights (2023-2024).
Methods (PVB):
Predictive Value per Byte is defined as: PVB = (AUC × Accessibility/Quality) ÷ Cost
AUC is a representative task-level predictability estimate. AUC values used were: EHR = 0.75–0.80, Labs/Vitals = 0.72–0.78, Genomics (PRS) = 0.70–0.80, Wearables = 0.80–0.85, Imaging = 0.80–0.95.
AQ is a 0–1 composite reflecting:
- Standardisation maturity (e.g., FHIR/LOINC/VCF interoperability readiness)
- Regulatory and governance burden (compliance, consent, privacy constraints)
- Cross-harmonisation difficulty (degree of schema variability between sources)
- Real-world availability and data completeness
Each sub-dimension is normalised 0–1 and averaged with example weights (0.30/0.25/0.25/0.20)
| Modality | S (standardisation) | G (governance) | H (harmonisation) | A (availability) | AQ (weighted composite) | Sources |
|---|---|---|---|---|---|---|
| Wearables | 0.8–0.9 | 0.7 | 0.8 | 0.9 | 0.85–0.88 | IEEE Sensors Journal (2023); Apple/WHO Digital Biomarker Consortium; FDA Digital Health Policy (2024) |
| EHR | 0.9 | 0.8 | 0.7 | 0.8 | 0.80–0.83 | ONC Interop Standards Advisory; HL7/FHIR; OECD Health Data Governance (2023) |
| Labs | 0.7 | 0.8 | 0.6 | 0.7 | 0.65–0.70 | LOINC adoption reports; ISO 15189 standardisation metrics |
| Imaging | 0.6 | 0.7 | 0.4 | 0.5 | 0.45–0.55 | DICOM interoperability reports; Radiology AI consortiums (RSNA 2023) |
| Genomics | 0.4 | 0.5 | 0.3 | 0.3 | 0.30–0.35 | GA4GH harmonisation WG; EMBL-EBI data governance survey (2024); Nature Genetics “Data Ecosystems” (2023) |
Cost represents an order-of-magnitude marginal cost per patient to acquire, standardise, and feature-engineer the modality. Values are aligned for relative comparison, not exact cost accounting for any single institution. Cost estimates used were: EHR = $5–$20, Labs = $30–$60, Genomics = $100–$300, Wearables = $80–$150, Imaging = $80–$200.